STATISTICAL PROGRAMMING / DATA ENGINEERING / AI AUTOMATION
STATISTICAL PROGRAMMERClinical data · R · Automation
FROM DATA TO DECISIONSBuilt for reproducibility.
01IngestEDC · APIs
02StandardizeSDTM · ADaM
03ValidateQuality checks
04DeliverTables · Figures
~4 yearsIn clinical data & automation
~30%Improvement in workflow efficiency
Global CROsCross-functional clinical collaboration
01 / WORK
Clinical data. Made visible.
Oncology visualizations in R, followed by the reusable systems and automation that support reliable data work.
FEATURED / ONCOLOGY VISUALIZATIONR · ggplot2 · Clinical data
01 / TREATMENT JOURNEYS
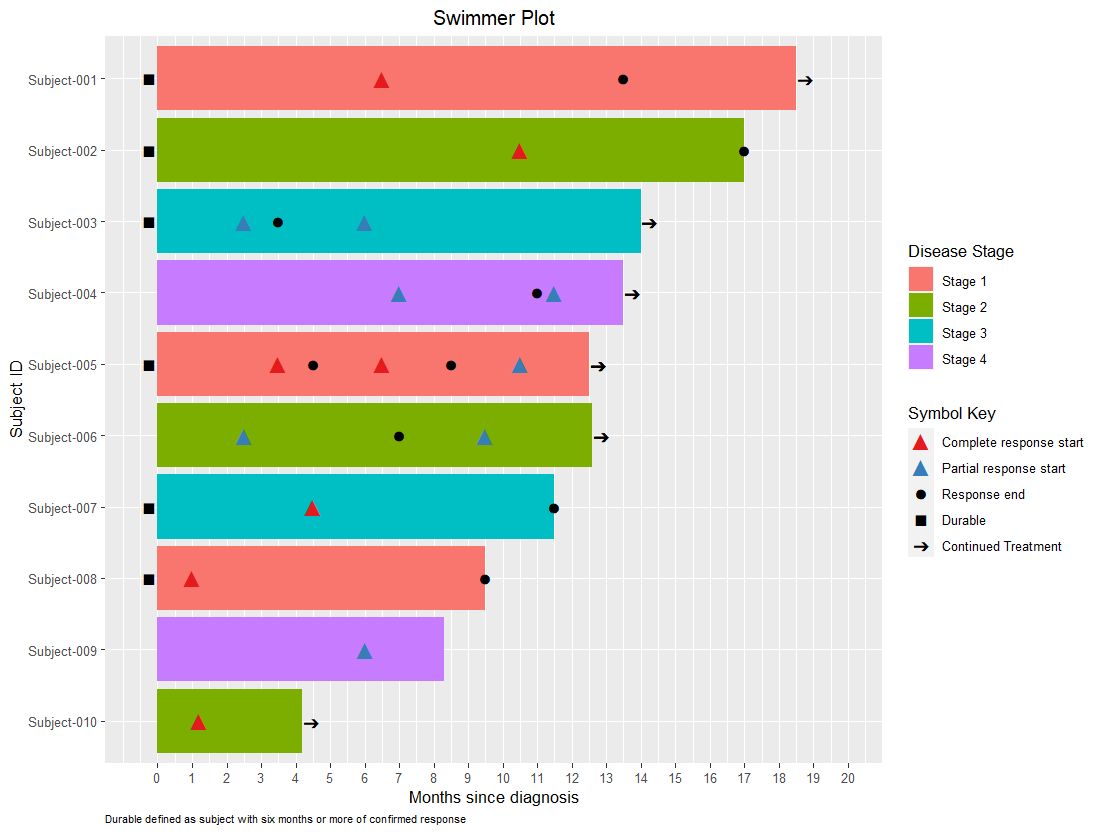
Swimmer plots
Show each subject’s treatment journey on a shared timeline. Disease-stage colors and milestone symbols bring treatment duration, response starts, and ongoing treatment into one view.
The original post explores response duration and disease-stage views, with ggplot2 and Plotly.
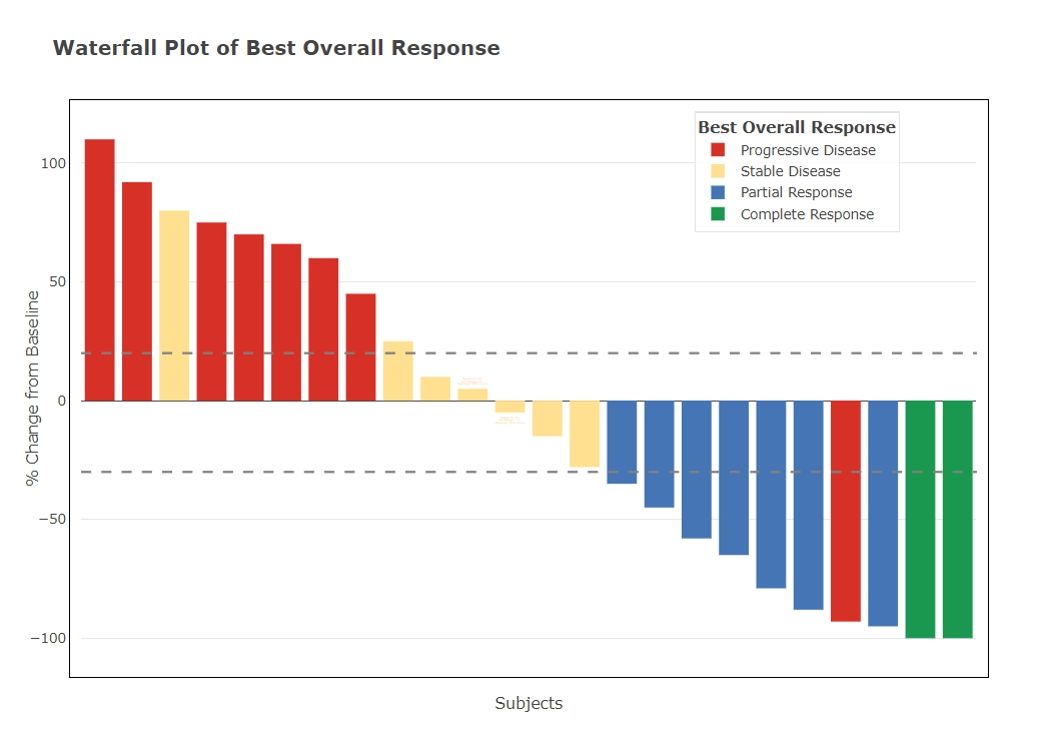
A subject-by-subject view of percentage change from baseline, with ordered bars and response categories to make differences across the study easy to compare.
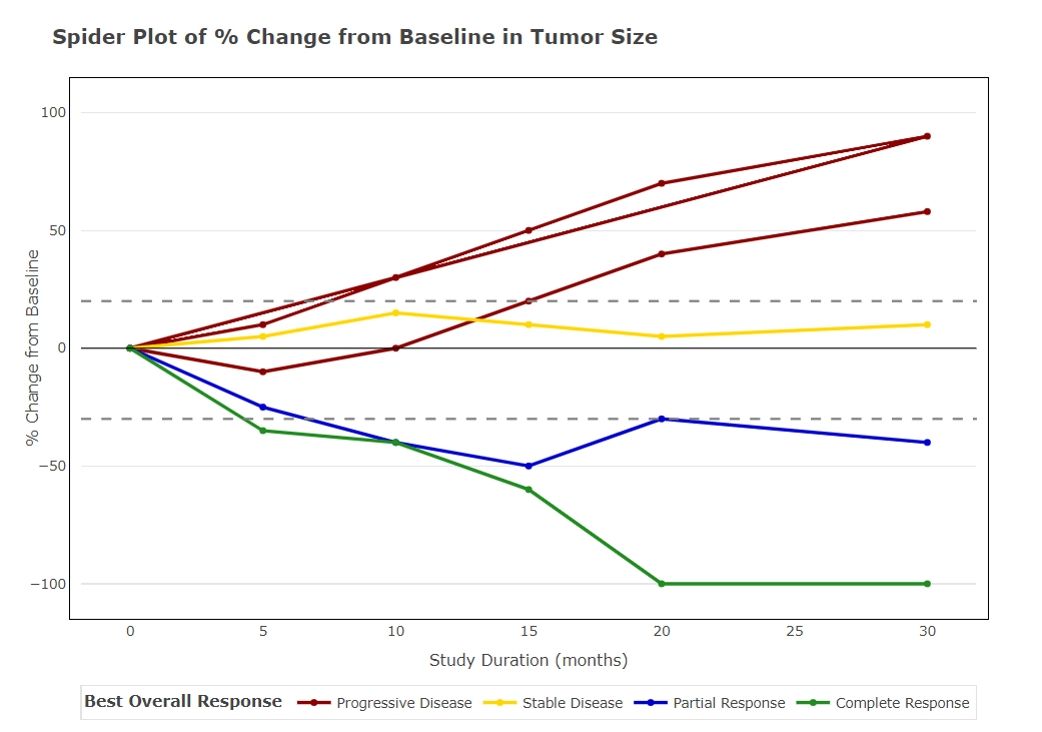
Follow individual tumor-size trajectories across visits. Longitudinal lines reveal patterns of response and progression that a single summary cannot show.
Original figures from my LinkedIn posts. These examples include dummy data for demonstration; they are not clinical study results. Select a figure to view it at full size.
MACHINE LEARNING / EXPLORATION
Anomaly detection & clustering
An experiment using Isolation Forest and K-Means on dummy crypto transaction data, exploring how anomaly scores can enrich clustering. The post also considers possible clinical data-quality applications.
A sample-data experiment combining multiple visualizations with tidyplots and patchwork, exploring how R can turn separate charts into a cohesive data story.
Internal R packages that standardize dataset creation and reporting across CRO engagements, supporting consistent, reproducible deliverables.
R packagesCDISCSDTM / ADaM
DATA ENGINEERING02
Clinical data pipelines & quality checks
Modular R and Python workflows for ingestion, transformation, and validation, with Redis-based processing for high-volume data.
Contributed to approximately 30% greater workflow efficiency.
PythonRRedisETL
DATA VISUALIZATION03
Clinical review dashboards
Interactive dashboards and reporting tools that help study teams review clinical data, monitor quality, and investigate findings.
ShinyPlotlyggplot2
AI & AUTOMATION / 202404
From a prompt to a published format.
AI content automation pipeline
A multi-stage n8n and OpenAI API workflow for content generation, formatting, and distribution—reducing turnaround from hours to minutes per cycle.
GenAI news video pipeline
Generated scripts, gTTS audio, and MoviePy video assembly combined into an automated production workflow.
n8nOpenAI APIsgTTSMoviePy
02 / EXPERIENCE
A foundation in reliable data.
Working across statistical programming, biostatistics, and data management teams in regulated clinical environments.
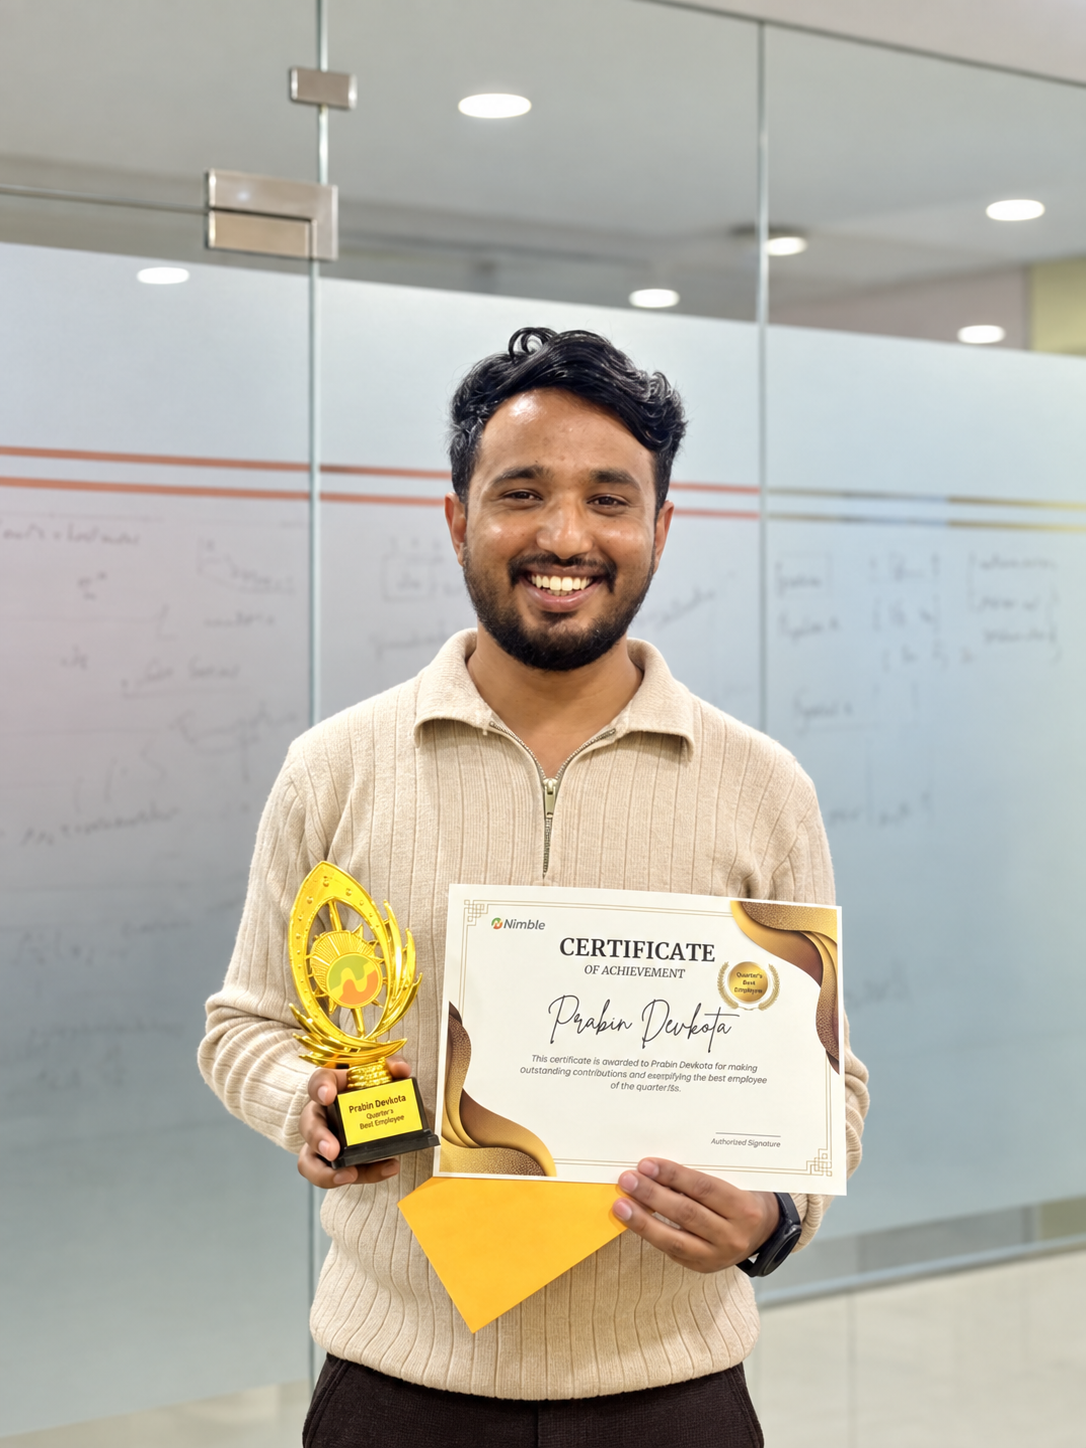
Employee of the QuarterNumeric Mind · Q3 2025
OCT 2022 — PRESENTKathmandu, Nepal
Senior Data Analyst & Statistical Programmer
Numeric Mind Pvt. Ltd.
Embedded with global contract research organization (CRO) teams through the Functional Service Provider model.
Develop internal R packages for SDTM and ADaM datasets and clinical reporting.
Build reusable validation frameworks, ETL pipelines, and automated EDC review workflows.
Support quality and timely delivery across concurrent clinical projects.
Recognition Employee of the Quarter · Q3 2025
JAN — MAR 2022
Python Developer Trainee
InfoDevelopers Pvt. Ltd.
Built Django backend components, PostgreSQL integrations, and REST APIs for workflow applications.
JUL — OCT 2021
Cybersecurity Analyst Intern
OneCover Pvt. Ltd.
Monitored network traffic with Wireshark and Splunk and supported security controls, audits, and awareness activities.
03 / ABOUT & TOOLKIT
Curious by nature. Methodical by practice.
I bring a software development foundation to clinical data work, combining statistical programming with practical automation. Based in Kathmandu, I collaborate with global teams to make complex workflows easier to trust and maintain.